About this tutorial
This is an embedded-rust tutorial using the esp32-c6 board.
Rust knowledge is assumed, but no embedded experience is required. The content was written for Unix (Linux, MacOS).
The book aims to be self-contained, but short reading material will be suggested. If the license allows for, we will copy useful content here, and provide the source.
Required Hardware
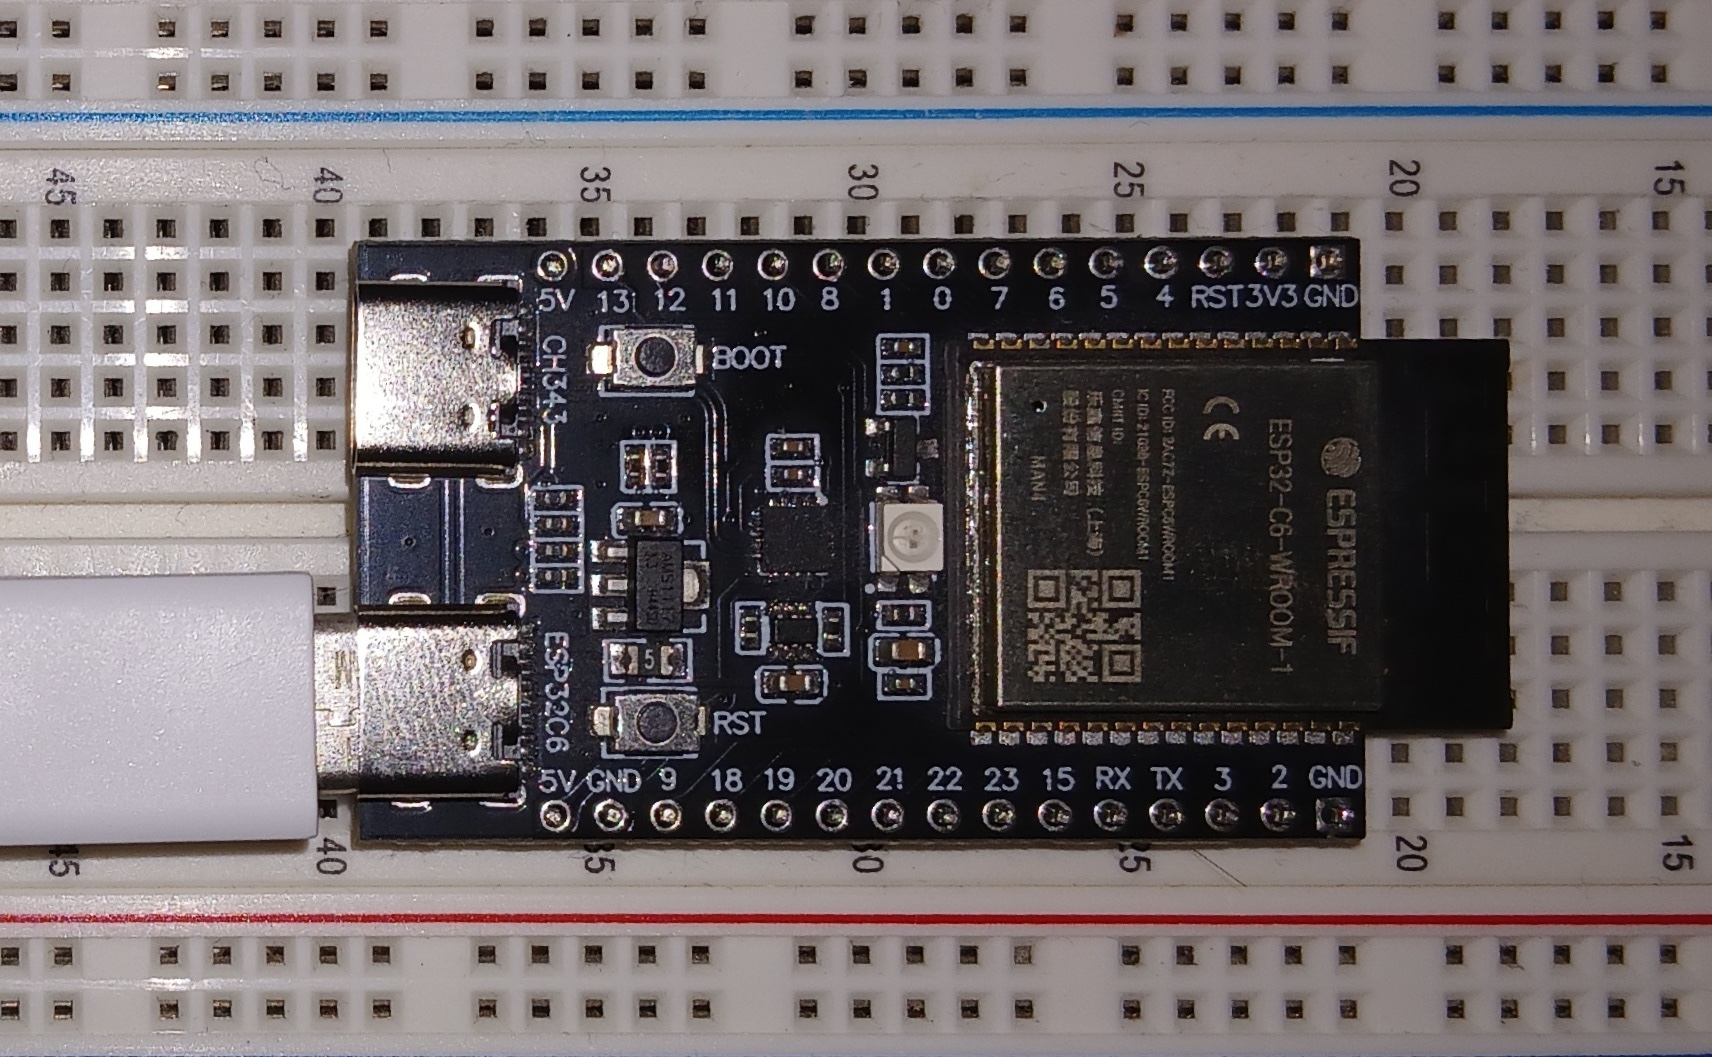
The esp32-c6 board is available on Mouser, Aliexpress and other retailers. It should look similar to:
Other required hardware:
-
USB-C cable to link your computer and the board.
- The cable has to support data transfers and not be power-only.
-
One resistor, 2 jumper wires, one LED, one breadboard. These are needed for Blinky and Handle Input chapters.
Workshop repository
The source for the book and code-exercises is at https://github.com/iampi31415/iampi31415.github.io. To get started, clone repo and then change directory:
git clone https://github.com/iampi31415/iampi31415.github.io
cd iampi31415.github.io
Repository contents. The directory contains:
book/: markdown sources of this bookexercises/: code examples and exercises
Suggested reading
- esp32-c6 user guide: you can find the labelled components, list of peripherals, and schematics.
Related resources
- Awesome ESP Rust
- esp-rs community on Matrix
Definitions
Board, components and peripherals
The board, as shown earlier, is:
The board then, is the whole item. Its main parts are:
- The printed circuit board (PCB): the flat fiberglass sheet underneath it all.
- The components: modules on top of the PCB. They interconnect with traces which are thin copper wires. Examples of components: MCU, USB ports LEDs, Pins.
- The microcontroller or microcontroller unit (MCU): the big square labelled ESP32-C6-WROOM (or some variant). It takes almost half the board. The MCU includes peripherals, CPU and RAM.
- The peripherals are parts of the MCU including: GPIO, UART, I2C, SPI, WiFi, Bluetooth and others.
- The microcontroller or microcontroller unit (MCU): the big square labelled ESP32-C6-WROOM (or some variant). It takes almost half the board. The MCU includes peripherals, CPU and RAM.
A nice explanation of how it all comes together is in the micro:bit v2 book:
Our MCU1 has 73 tiny metal pins sitting right underneath it (it’s a so called aQFN73 chip). These pins are connected to traces, the little “roads” that act as the wires connecting components together on the board. The MCU can dynamically alter the electrical properties of the pins. This works similarly to a light switch, altering how electrical current flows through a circuit. By enabling or disabling electrical current to flow through a specific pin, an LED attached to that pin (via the traces) can be turned on and off.
What is no_std?
This tutorial is “no_std”, but what does it mean? std can refer to:
std: the cratestd: the component, including the cratesstd,core,allocamong others.
This book distinguishes them precisely by adding the words crate and component, respectively.
The microcontroller has no Operative System, but std crate relies on one. Hence, #[no_std] is used in main.rs to indicate that std crate should be excluded.
To be precise alloc is excluded by default but can be added. A comparison is provided by this the table below, copied from the Rust Embedded Guide:
| feature | no_std | std |
|---|---|---|
| heap (dynamic memory) | * | ✓ |
| collections (Vec, BTreeMap, etc) | ** | ✓ |
| stack overflow protection | ✘ | ✓ |
| runs init code before main | ✘ | ✓ |
| libstd available | ✘ | ✓ |
| libcore available | ✓ | ✓ |
| writing firmware, kernel, or bootloader code | ✓ | ✘ |
* Only if you use the alloc crate and use a suitable allocator like esp-alloc.
** Only if you use the collections crate and configure a global default allocator.
** HashMap and HashSet are not available due to a lack of a secure random number generator.
-
Refers to a different MCU than ours but the concept is the same. ↩
Hardware
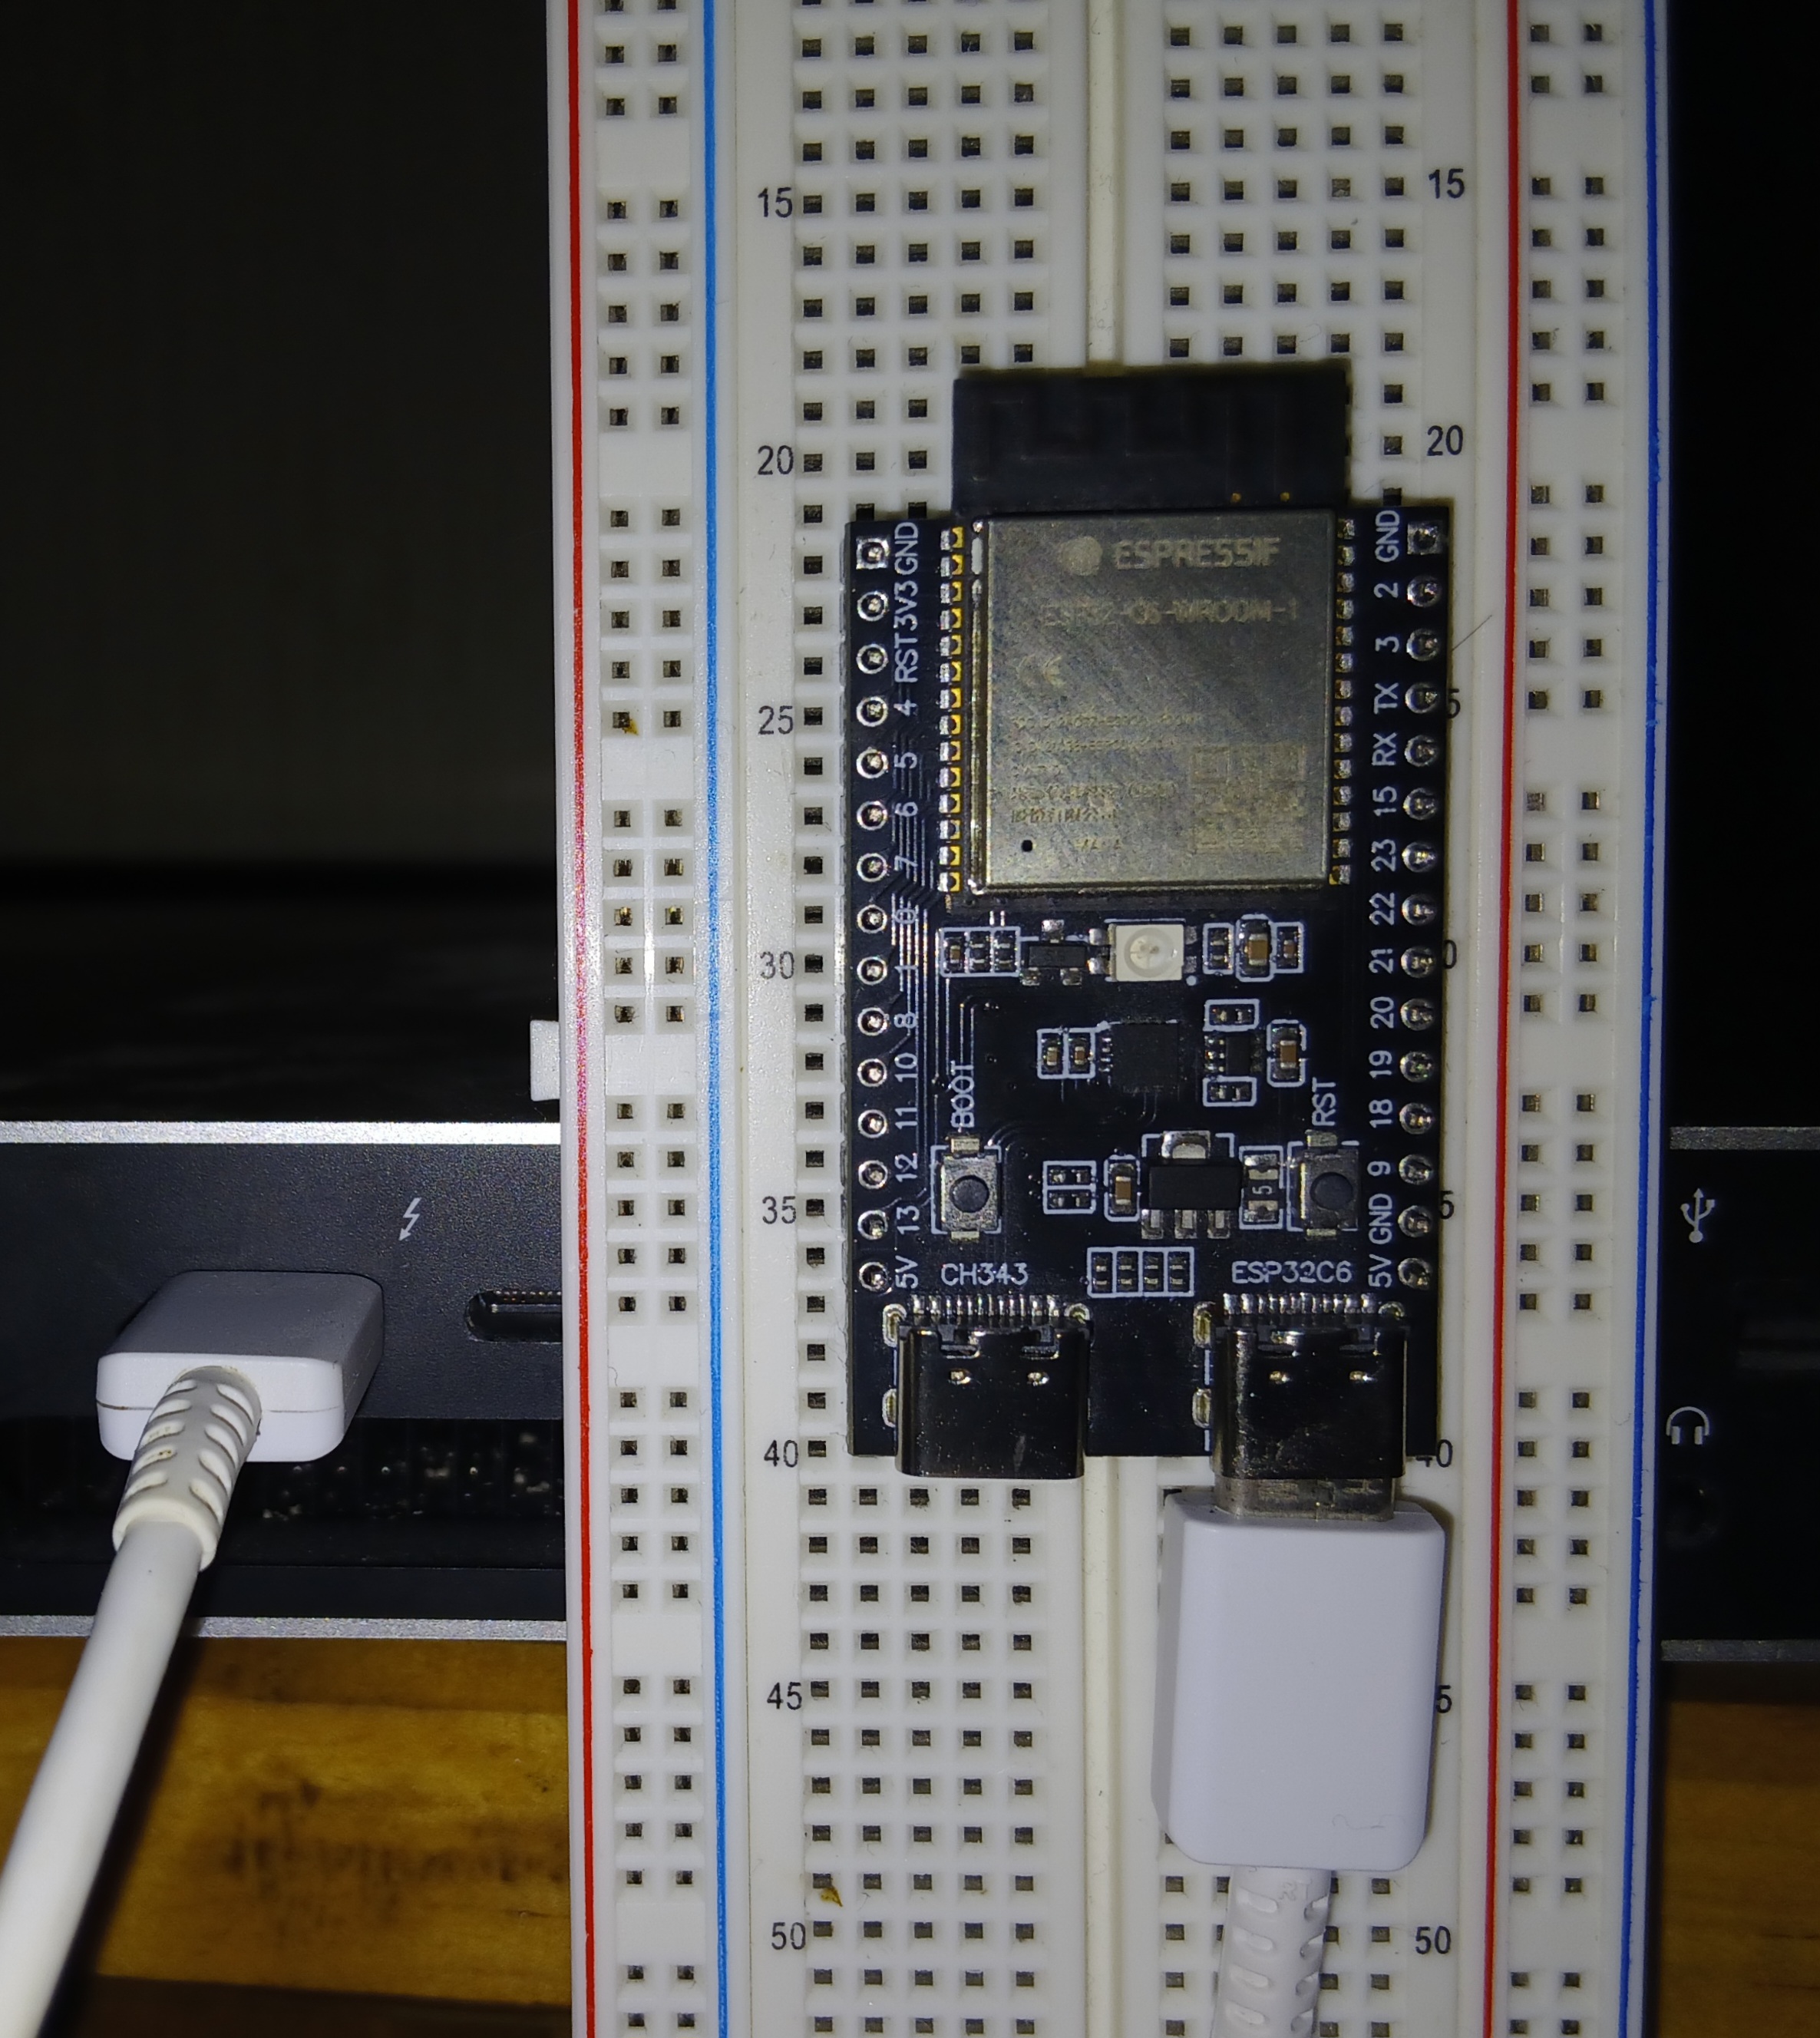
Now it’s time to connect the host computer with the development board.
- Plug one end of the USB to the computer’s USB port.
- Plug the other end to the board’s esp32c6-tagged USB port (or you may see a USB tag.)
- A tiny red control LED may light up (if the board is brand new.)
Note
The esp32-c6 also has an extra USB port, which is UART or ch343-tagged. ch343 is used to communicate with the UART peripheral inside the MCU. Both ports can be used for flashing and both can be monitored.
List the USB ports with lsusb | grep usb. If lsusb is unavailable with ls /dev/tty*usb*. Examples:
-
With
lsls /dev/tty*usb* # /dev/tty.usbmodem101 -
With
lsusblsusb | grep JTAG # Bus (...) USB JTAG/serial debug unit (...)
Linking board and laptop through USB-C
Now that the board is wired to our laptop, and registered by our OS, let’s set up the needed software.
Software
Let’s install all we need.
Rust Tools
-
Install the Rust toolchain following the steps in https://rustup.rs/
- The Rust Toolchain is
rustupplus many componentscargo,rustc, the compiledstdcomponent and so on.
- The Rust Toolchain is
-
Add the compiled
std-component for our target microcontrollerrustup target add riscv32imac-unknown-none-elf -
Add development components:
rustup component add rust-analyzer rust-srcrust-srcis thestd-component’s source code, used byrust-analyzer.
Espressif tools
espflash is used for flashing our ELF binary (our program) into the board.
Install espflash with: cargo install espflash
Build dependencies
-
Debian/Ubuntu.
sudo apt install llvm-dev libclang-dev clang -
MacOS. When using the Homebrew package manager, which we recommend:
brew install llvm
Additional Software
- Editor: Neovim, Zed, VSCode, Helix.
Rust AnalyzerLSP, for code completion, formatting.Even Better TOMLLSP, for editing TOML based configuration files
Hello World
There is a lot to learn, so let’s start simple.
-
Connect the board to your computer and access the first project:
cd exercises/hello_world -
Build, flash, and monitor the project with
cargo run. You should see:.. 0x4080082e - handle_interrupts at ??:?? .. Commands: CTRL+R Reset chip CTRL+C Exit .. loop..! ..We will talk about the
at ??:??in the next chapter aboutpanic!.The
loop..!logs come from esp-println. They provide us withdbg!,print!andprintln!.
Build, flash and monitor?
The .cargo/config.toml includes this config:
[target.riscv32imac-unknown-none-elf] # our processor arch.
runner = "espflash flash --monitor"   # for `cargo run`.
Our cargo run is replaced by cargo build && espflash flash <elf_path> --monitor.
Note
This builds and flashes the binary. Then monitors for any logs. Without the
--monitorit flashes and exits instead of waiting and printing logs.
Exercise
esp-println supports backends log and defmt which provide info!, warn! other macros. Let’s try adding them:
- Uncomment the lines in
src/main.rsand inCargo.tomlto enablelog. - The
logcrate logging level is controlled withESP_LOGunder the[env]section in.cargo/config.toml.-
Change the
ESP_LOGvariable to turnoffall logs. Re-runcargo run --release, to test how it works. -
Try with other levels, for example, with
trace.
-
The exercises/hello_world/examples/hello_world.rs contains a solution.
You can run it with the following command cargo run --release --example hello_world. You should first fix the lines at the bottom of Cargo.toml.
Suggested Reading
- esp-println
- log this one you can just peek at to have a general idea.
Panic
If something goes wrong, the program will panic!. In embedded, we will always need to add a panic-handler.
esp-backtrace provides a panic-handler feature that handles panic!. This is why we need to use esp-backtrace as _.
Let’s access the project at exercises/panic, and modify the code to test panic!.
We will also take a look at compilation profiles. We don’t need deep knowledge about profiles, just the very basics.
cargo uses profile-settings to control compilation using defaults when unspecified. We are interested in controlling a few aspects:
- Should it be as fast as possible? As short as possible?
- Should it include information useful for debugging?
Exercise: part 1
-
In
main.rsuse theesp-backtracecrate. -
Then add a
panic!somewhere, e.g. after ourprintln. -
Run the code with
cargo run; this uses the development profile.- It outputs debug information into the compiled binary.
-
Then run with release profile
cargo run --release.-
This profile will not output all debug information in the binary. We should find:
Hello world!
====================== PANIC ======================
panicked at examples/panic.rs:24:5:
This is a panic
Backtrace:
0x4200252a
main
    at ??:??
The default
--releasebehaviour excludes debug information and minimises the binary size; the backtrace shows the missing debug information with??.
-
Exercise: part 2
We nearly always use --release (we want small binary size). If we want debug information we need to configure the release profile in .cargo/config.toml:
+[profile.release]
+debug = true
Now it will emit debug information in the ELF binary file; yet debug info isn’t flashed into the target, it is just used to display the backtrace.
- Re-run the program with
--releaseand confirm??:??is now filled in.
exercises/panic/examples/panic.rs contains a solution. It can be run with: cargo run --example panic --release.
Recap
esp-backtracehandles panics (by us or by any library).- We can manually use
panic!to exit the program. - Configure compilation so that panics print a backtrace with all debug information.
Suggested Reading
Blinky
We will now create the iconic blinky.
Let’s access the project with cd exercises/blinky. We will need to edit the file main.rs.
On esp32-c6 board there is no regular LED connected, instead there is an addressable LED which works differently and is beyond the scope of this book.
Instead, we will use a regular LED and a resistor, and build a circuit controlled with the GPIO pin headers.
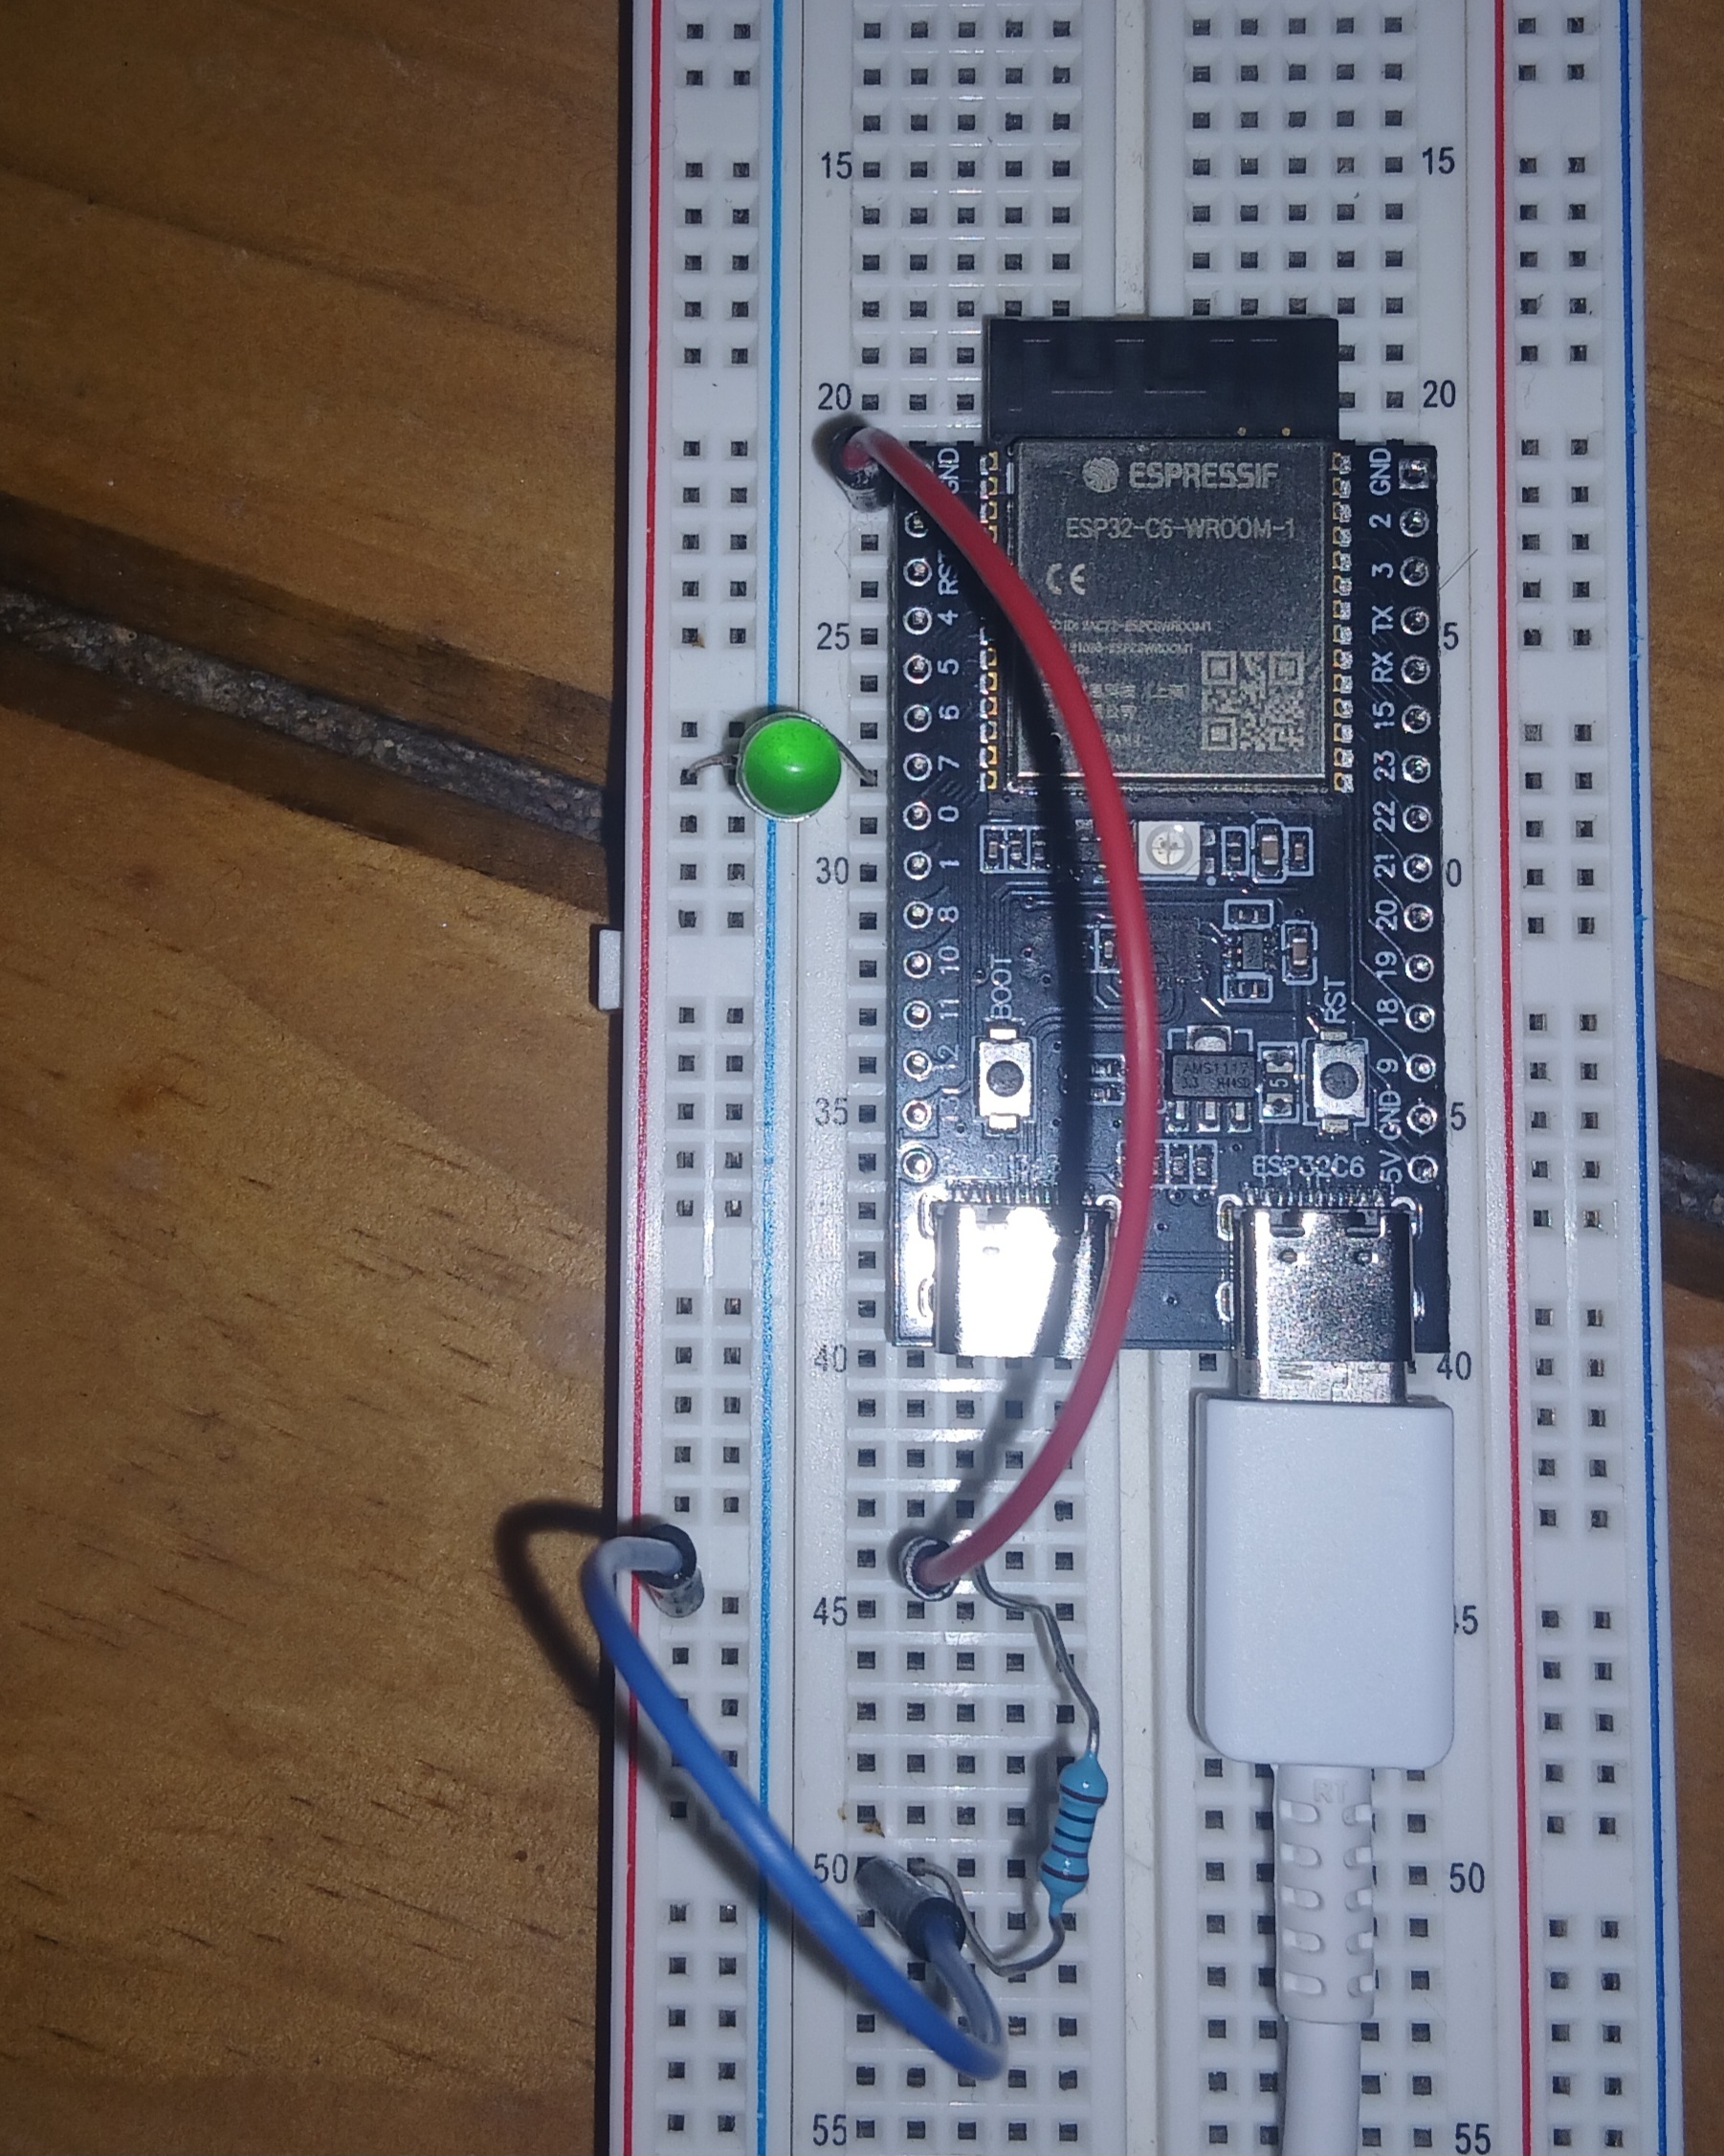
esp32-c6, wiring the LED
Wire up the board as shown on the previous image:
-
Start wiring from
GNDpin header (red wire), -
From there to the resistor (220mΩ or otherwise, without it the LED blows up.)
-
From the other leg of the resistor to the LED (blue wire),
-
Finally, the LED connects to GPIO7 (the long LED-leg is on GPIO7.)
Exercise
- Create
OutputConfigwith default configuration.- Hint: it implements
Default.
- Hint: it implements
- Toggle the
ledwith 3500ms delay.
The exercises/blinky/examples/blinky.rs contains a solution.
You can run it with the following command cargo run --example blinky --release.
Handle Input
Using same wiring from the blinky chapter, let’s now use external input to make the LED blink.
- Access
exercises/handle_inputin order to editmain.rs.
Exercise
We will use the button labelled BOOT linked to GPIO9 to toggle the LED.
- Initialise the peripherals with default config (check previous exercises)
- Set the
ledvariable toOutput::newpassingGPIO7peripheral,Level::Highand defaultOutputConfig. - Set the
btnvariable toInput::newpassingGPIO9peripheral, defaultInputConfigbut overwrite withas_pull(Pull::High). - Add the logic inside
loop- When pressing it should turn the
ledon, and delay it 2 seconds - Then it turns itself off.
- When pressing it should turn the
The exercises/handle_input/examples/handle_input.rs contains a solution. You can run it with the following command cargo run --example handle_input --release.
defmt
defmt is an efficient logging framework. Just like log, the defmt crate enables defmt::info, defmt::warn and other levels. It also has a defmt::println! macro.
The name defmt comes from deferred formatting:
(…) instead of formatting
255u8into"255"and sending the string, the single-byte binary data is sent to a second machine, the host, and the formatting happens there.
So the formatting is deferred to the host. The other bit improving efficiency is compression:
defmt’s string compression consists of building a table of string literals, like"Hello, world"or"The answer is {:?}", at compile time. At runtime the logging machine sends indices instead of complete strings.
Source: defmt docs.
defmt Ecosystem
esp-println, esp-backtrace and espflash provide mechanisms to use defmt:
-
espflashhas support for different logging formats, one of them beingdefmt. -
esp-printlnneedsdefmt-espflashfeature. As their docs state:Using the
defmt-espflashfeature,esp-printlnwill install adefmtglobal logger. Updated theCargo.toml’s features. -
esp-backtraceneeds adefmtfeature that usesdefmtlogging to print panic and exception handler messages.
Exercise
Go to exercises/defmt directory.
-
Update the runner’s logger in
.cargo/config.toml:[target.riscv32imac-unknown-none-elf] - runner = "espflash flash --monitor" + runner = "espflash flash --monitor -L defmt"so that
espflashmonitor can decode the format of thedefmtmessages received. -
Update
Cargo.tomlto include the needed features:esp-println = { version = "0.16.0", features = [ "esp32c6", - "log-04", + "defmt-espflash", ] } # (...) esp-backtrace = { version = "0.18.0", features = [ "esp32c6", "panic-handler", + "defmt", ]} -
Due to the linking process we need to add
defmtlinker script tocargo/config.toml:rustflags = [ # .... + "-C", "link-arg=-Tdefmt.x", ] -
Add defmt to the dependencies.
-
Logging level: Use the
defmt::println!and some defmt macros to print a few messages.-
When building the app, set
DEFMT_LOGlevel as done forESP_LOGearlier. -
An alternative to changing
.cargo/config.tomlis usingDEFMT_LOG=<value> cargo run --release; the same is valid forESP_LOG.
-
-
Add a
panic!macro to trigger a panic with adefmtmessage.
exercises/defmt/examples/defmt.rs contains a solution. You can run it with the following command: cargo run --example defmt --release. You will need to have the settings above done correctly though!
Suggested reading
Short articles that give more context:
- defmt linking process for setting the compilation-time linker up
- defmt DEFMT_LOG environment variable
- esp-println logging formats
Set Up
Programs are debugged using:
dbg!orprint!information to know the value of a variable.assert!expected values- Write unit tests
To access these finer details, we can use a debugger.
Software needed
Two programs will be needed:
- GNU Debugger (
gdb): inspect and stop the program as it runs.- Linux has
gdbinstalled. On MacOS, install it withbrew install gdb.
- Linux has
- OpenOCD (
openocd): handles the communication with the board.
OpenOCD
Download the latest openocd for your laptop architecture from the openocd-esp32 github repo. The repo is a fork of openocd targetted at esp32 boards.
Important
Please, check the commands before executing them.
- For Linux amd-64:
# Linux amd64. See releases page for other archs. cd ${HOME} # go to home so we download in a visible place. OPENOCD_ZIP_NAME=openocd-esp32-linux-amd64-0.12.0-esp32-20250707.tar.gz DATE=v0.12.0-esp32-20250707 wget https://github.com/espressif/openocd-esp32/releases/download/${DATE}/${OPENOCD_ZIP_NAME} tar -xvf ${OPENOCD_ZIP_NAME} - For MacOS arm64:
cd ${HOME}
OPENOCD_ZIP_NAME=openocd-esp32-macos-arm64-0.12.0-esp32-20250707.tar.gz
DATE=v0.12.0-esp32-20250707
wget https://github.com/espressif/openocd-esp32/releases/download/${DATE}/${OPENOCD_ZIP_NAME}
tar -xvf ${OPENOCD_ZIP_NAME}
Important
Below, it is assumed the output of the command above was a directory named
openocd-esp32.
Modify the PATH
Let’s add a path to the PATH variable, by editing the .zshrc or .bashrc file.
Additionally, the OPENOCD_SCRIPTS variable is defined. openocd uses that variable to find the board’s configuration.
# add `openocd` to PATH
export PATH=${HOME}/openocd-esp32/bin:${PATH}
# Define openocd scripts/configs location.
export OPENOCD_SCRIPTS="${HOME}/openocd-esp32/share/openocd/scripts"
Then source the profile:
source ~/.bashrc # or ~/.zshrc
Then check it is installed with openocd --version. Now to some exercises.
GDB
GDB commands
nextstep one line over.continueorc: continue executing up to next break point.break fn_name: break point at function name.- There may be many with same name. So we need the path.
- For example:
break gdb_hello_world::__risc_v_rt__main
- For example:
- There may be many with same name. So we need the path.
break lineno: break point at line number of currently-focused file.- Example:
break 19, orbr 19.
- Example:
break my_file.rs:lineno: examplebreak main.rs:17.monitor reset halt: restarts and halts it.- layout:
layout src: shows source code and CLI.layout asm: shows assembly source and CLI.tui disableto disable the layout.
info breakto show breakpointsinfo localsto show variables.print xto print variablex. Alsoprint &xprints the address ofx.
Exercises
- Access
exercises/gdb_hello_world - Inspect the configuration files
openocd.cfg(foropenocd) and.gdbinit(forgdb). - Execute
cargo run, leave out--releaseto use the development profile.- Without it, cargo will remove / optimise lines.
- We should debug with
--releaseto ensure the best outcomes. - But this examples is just to get started.
- Run
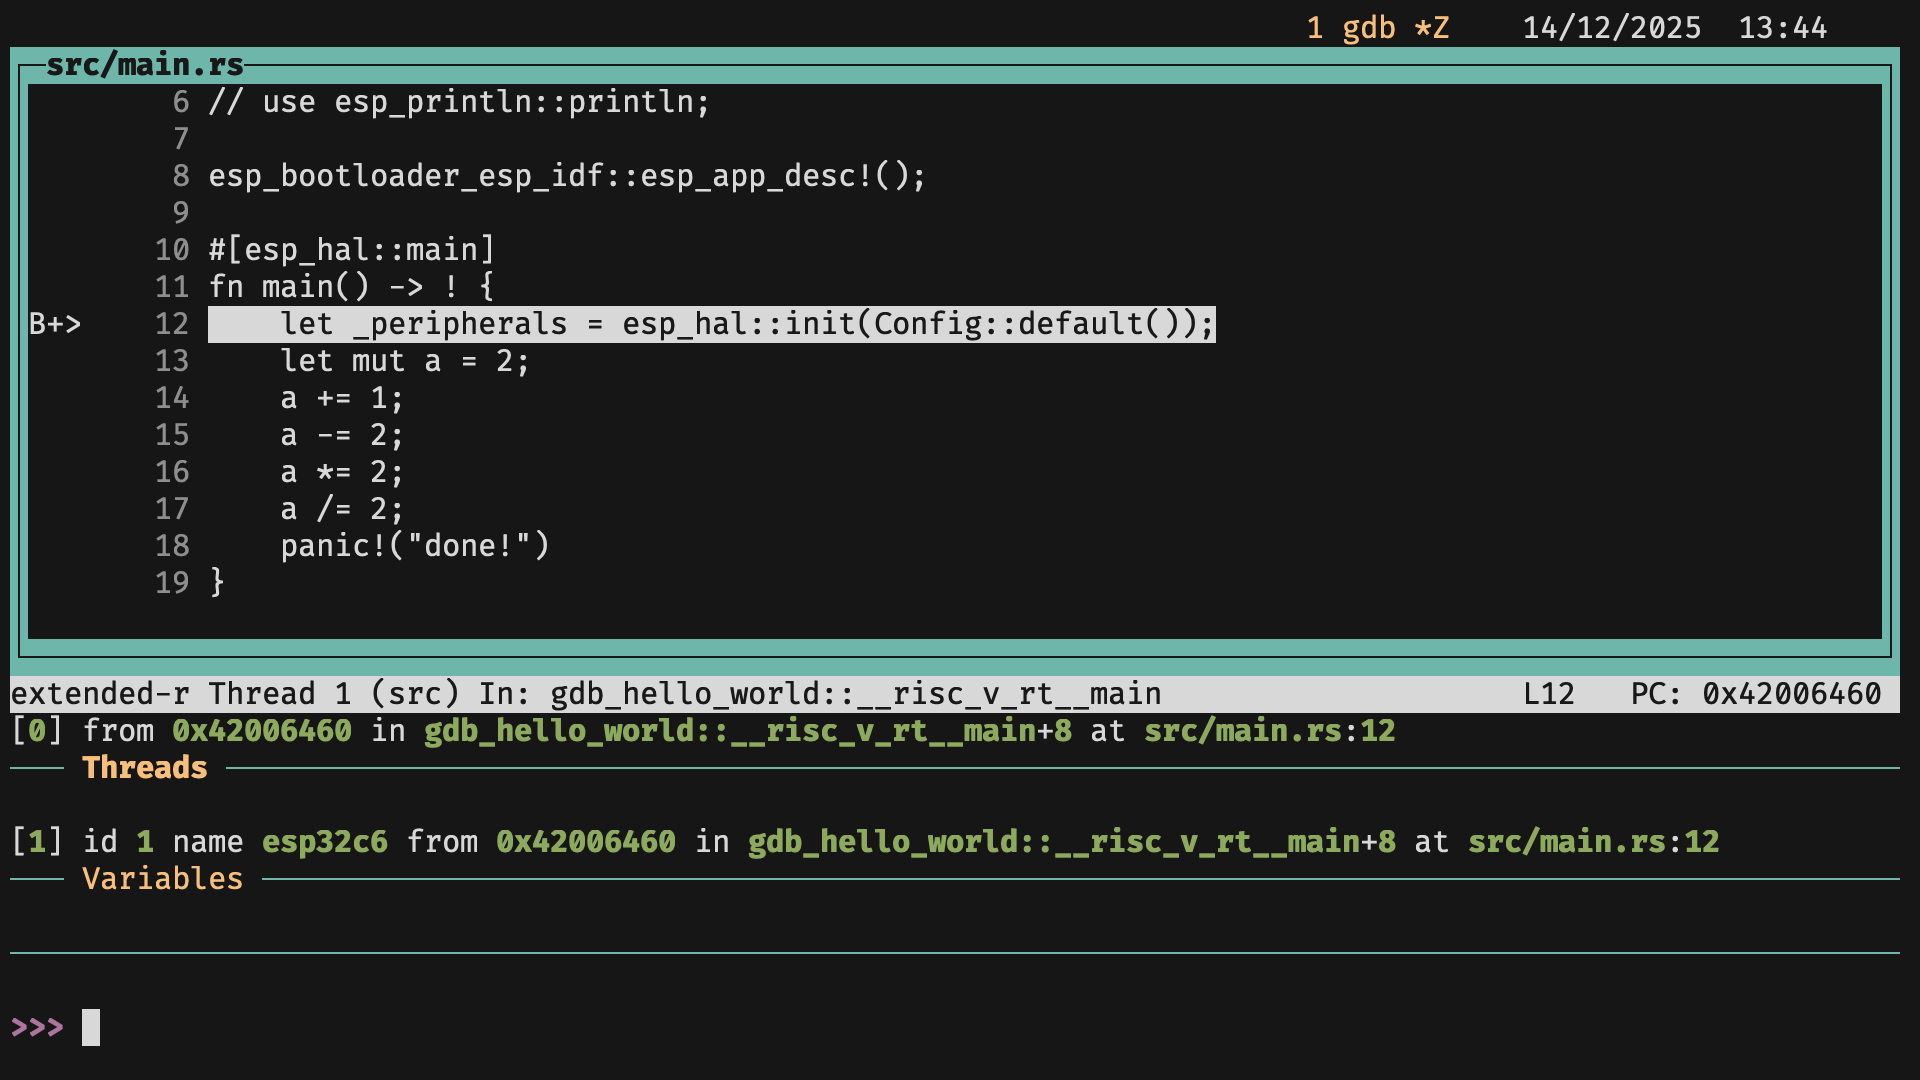
gdbin one terminal window, andopenocdin another window (same directory!). - The image shows what
gdbshould look like at this stage.- Should have a breakpoint in
_peripheralswhich meansgdbstopped execution there.
- Should have a breakpoint in
- Add a
breakpoint inmain.rswherea/=2 printthe resulting value.- Exit with
Ctrl+DorCtrl+C.