next step one line over.continue or c: continue executing up to next break point.break fn_name: break point at function name.
- There may be many with same name. So we need the path.
- For example:
break gdb_hello_world::__risc_v_rt__main
break lineno: break point at line number of currently-focused file.
- Example:
break 19, or br 19.
break my_file.rs:lineno: example break main.rs:17.monitor reset halt: restarts and halts it.- layout:
layout src: shows source code and CLI.layout asm: shows assembly source and CLI.tui disable to disable the layout.
info break to show breakpointsinfo locals to show variables.print x to print variable x. Also print &x prints the address of x.
- Access
exercises/gdb_hello_world
- Inspect the configuration files
openocd.cfg (for openocd ) and .gdbinit (for gdb).
- Execute
cargo run, leave out --release to use the development profile.
- Without it, cargo will remove / optimise lines.
- We should debug with
--release to ensure the best outcomes.
- But this examples is just to get started.
- Run
gdb in one terminal window, and openocd in another window (same directory!).
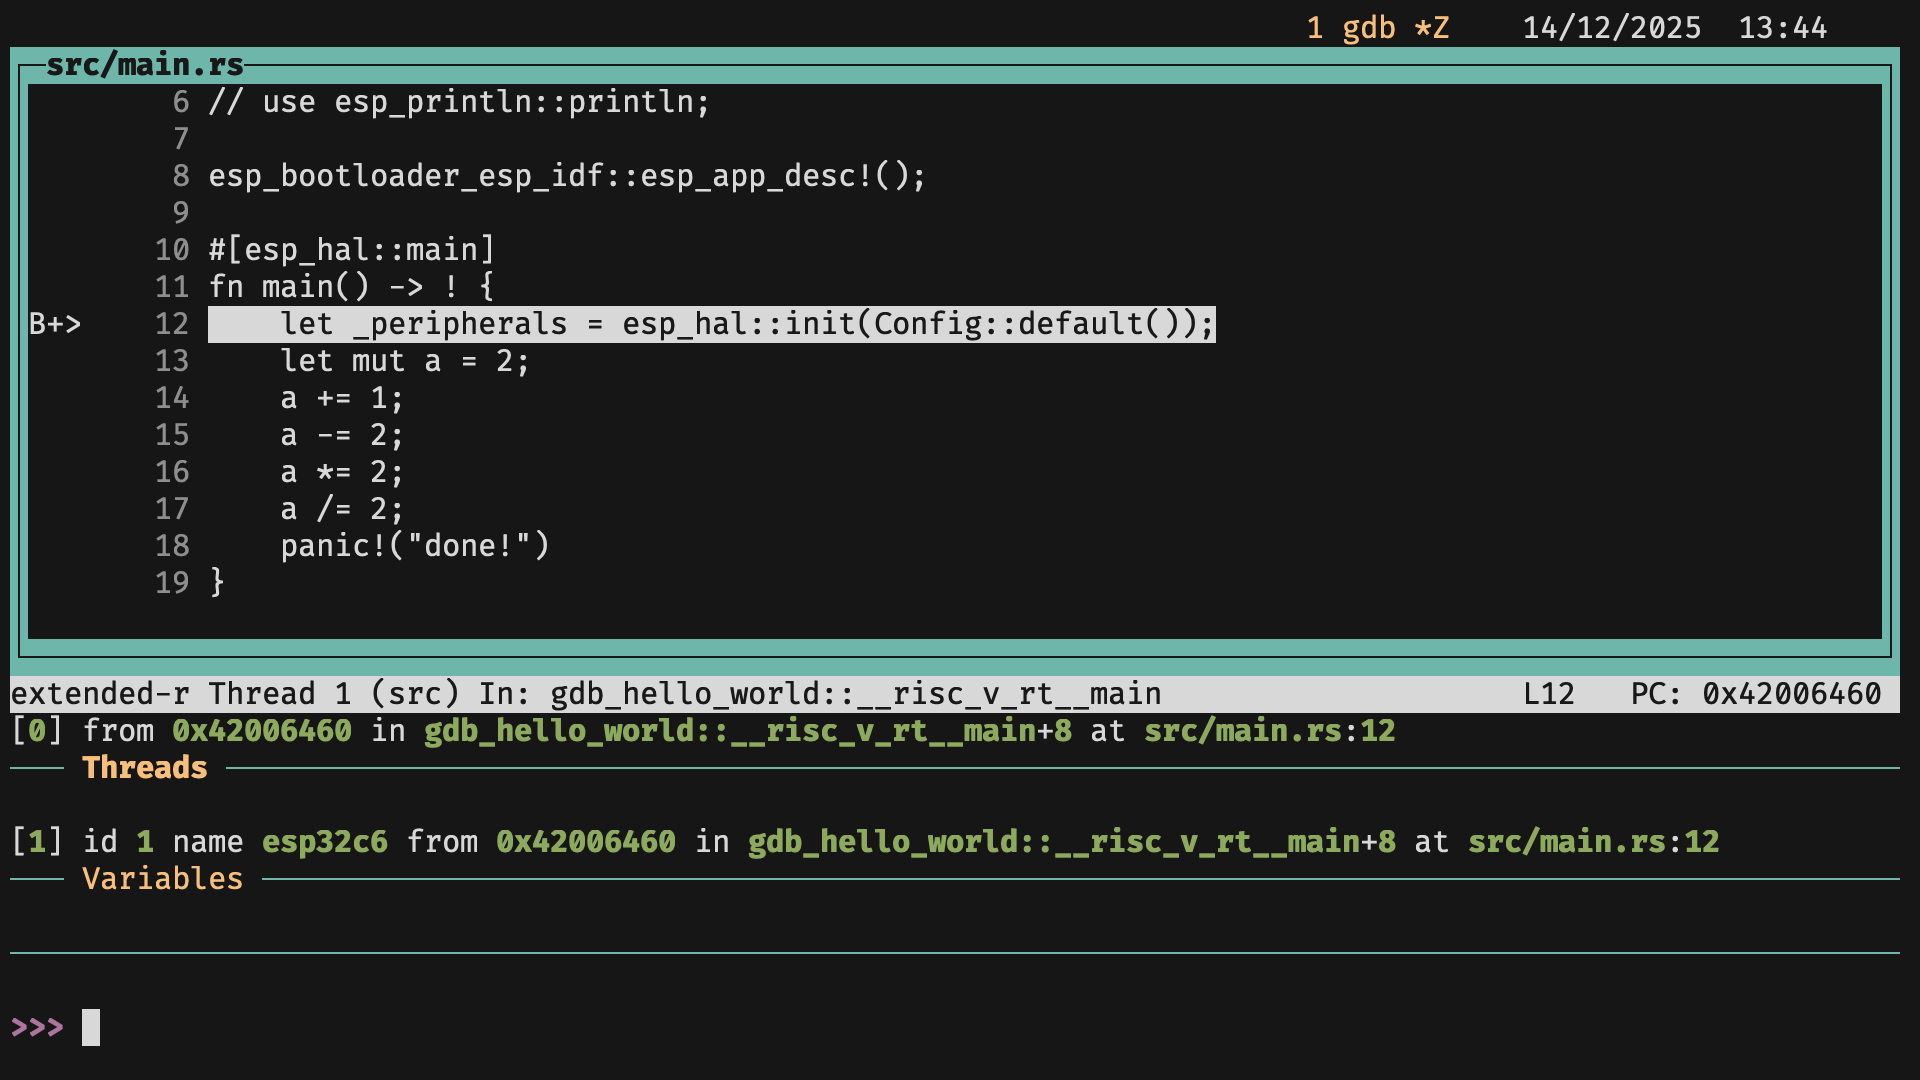
- The image shows what
gdb should look like at this stage.
- Should have a breakpoint in
_peripherals which means gdb stopped execution there.
- Add a
break point in main.rs where a/=2
print the resulting value.- Exit with
Ctrl+D or Ctrl+C.